Quick Summary
- A network diagram animation visually explains complex IT infrastructure and data flows.
- Traditional animation methods require hours of manual keyframing in complex software.
- Easymotion uses AI to generate these diagrams instantly from simple text prompts.
- You can export your final animation with a transparent background to overlay on any presentation or video.
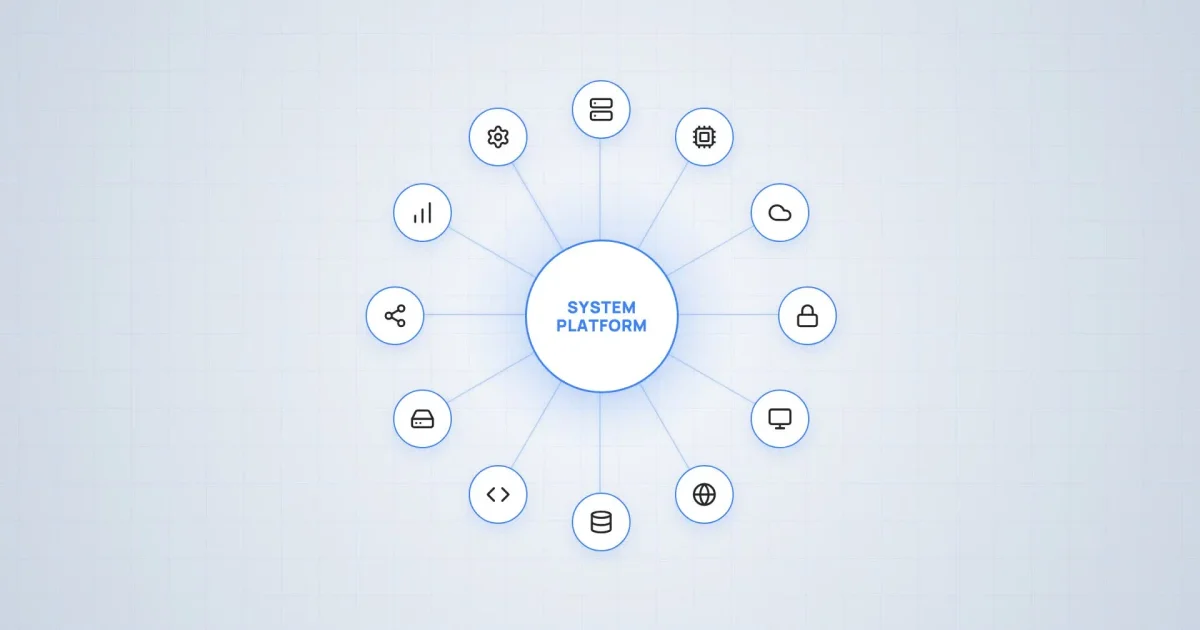
A network diagram animation is a dynamic visual model that illustrates how servers, databases, and devices connect within an IT infrastructure. By animating data packets moving along these pathways, it instantly clarifies complex system architectures for any audience.
Explaining intricate system setups to non-technical stakeholders often results in blank stares. I used to build these visuals manually in After Effects, and making a single data packet move from a server to a client device took 10 minutes of tedious keyframing. The process was incredibly slow and frustrating.
In 2026, you do not need expensive software or advanced design skills to build impressive tech presentation graphics. You can use an AI motion graphics generator to build a network diagram animation in seconds without touching a timeline.
How to Create a Network Diagram Animation with Easymotion
1Getting Started
Begin by navigating to Easymotion in your web browser. Click the "Start Creating" button located on the homepage. From there, log in to your existing account or sign up for a free trial to access the studio.
2Choosing a template or describing the prompt
Once inside the platform, you have two ways to generate your graphic. You can either browse the template library to find a starting layout, or you can type a prompt into the text input box to describe exactly what you want. For example, type: "Create a network diagram showing data flowing from a central cloud server to three mobile devices."
AI Motion Graphics Generator
Describe your motion graphics idea. Add a design reference if you'd like it to be recreated.
Describe your system architecture and let AI build the initial layout automatically.
3Customizing via the AI chat
After the initial generation, you can refine your design using the AI chat panel located on the left side of the screen. Type direct commands like "Change the server node icon to a database symbol" or "Make the data flow lines neon blue." The system processes your request and updates the video automatically on your canvas.
Use the AI chat on the left to customize node labels, colors, and line styles.
4Exporting the animation
When your data flow visualization looks perfect, click the Export button in the top right corner of the screen. You can select the MP4 format for a standard video file. If you need to overlay your diagram on top of other footage, choose the MOV format, check the 'Transparent' option, and export. This transparent file will work flawlessly in editing software like Premiere Pro or DaVinci Resolve.
Export your animation in transparent MOV or standard MP4 format.
Copy-Paste Prompts for Your Animation
Speed up your workflow by using these exact text prompts in the Easymotion studio. Just copy and paste them into the prompt box.
Cloud to Mobile Flow
Cybersecurity Architecture
API Integration Map
Use Cases
For YouTubers & Creators
Tech channels and educational creators constantly need to explain how software, hardware, and the internet work. Instead of relying on static whiteboard drawings, creators can use a network diagram animation to show real-time data flow. This keeps viewers engaged and makes abstract concepts like cloud computing or cybersecurity much easier to understand. If your tutorial involves step-by-step logic, you might also want to explore an AI Flowchart Animation Maker to map out user decisions alongside your server architecture.
For Marketers & Brands
B2B SaaS marketing relies heavily on proving that a product integrates smoothly into an existing tech stack. Marketers can use these animations in promotional videos or landing pages to visually demonstrate API connections and data syncing. Showing a secure, fast data flow visualization builds instant trust with prospective enterprise clients.
Perfect for tech presentations and B2B SaaS marketing materials.
For Startups & Founders
When pitching to investors, clarity is critical. Founders can use tech presentation graphics to explain their proprietary technology or platform scalability without getting bogged down in jargon. Visualizing the backend infrastructure proves technical competence. Startups can also pair these diagrams with an AI Data Chart Animation Maker to showcase user growth metrics right after explaining the system architecture.
Network Diagram Animation: Traditional Method vs AI
Creating technical animations has historically been an expensive and frustrating process. Here is how the traditional workflow compares to using Easymotion.
| Feature | Traditional Method (After Effects) | Easymotion AI |
|---|---|---|
| Time Required | Hours to days per diagram | Seconds to minutes |
| Skill Required | Advanced keyframing and design skills | None, just type what you want |
| Cost | $22.99/mo plus expensive third-party plugins | Basic $10/mo, Plus $20/mo, Pro $60/mo |
| Learning Curve | Months of tutorials and practice | Zero learning curve |
| Export Options | Requires manual render settings | MP4 up to 4K, Transparent MOV |